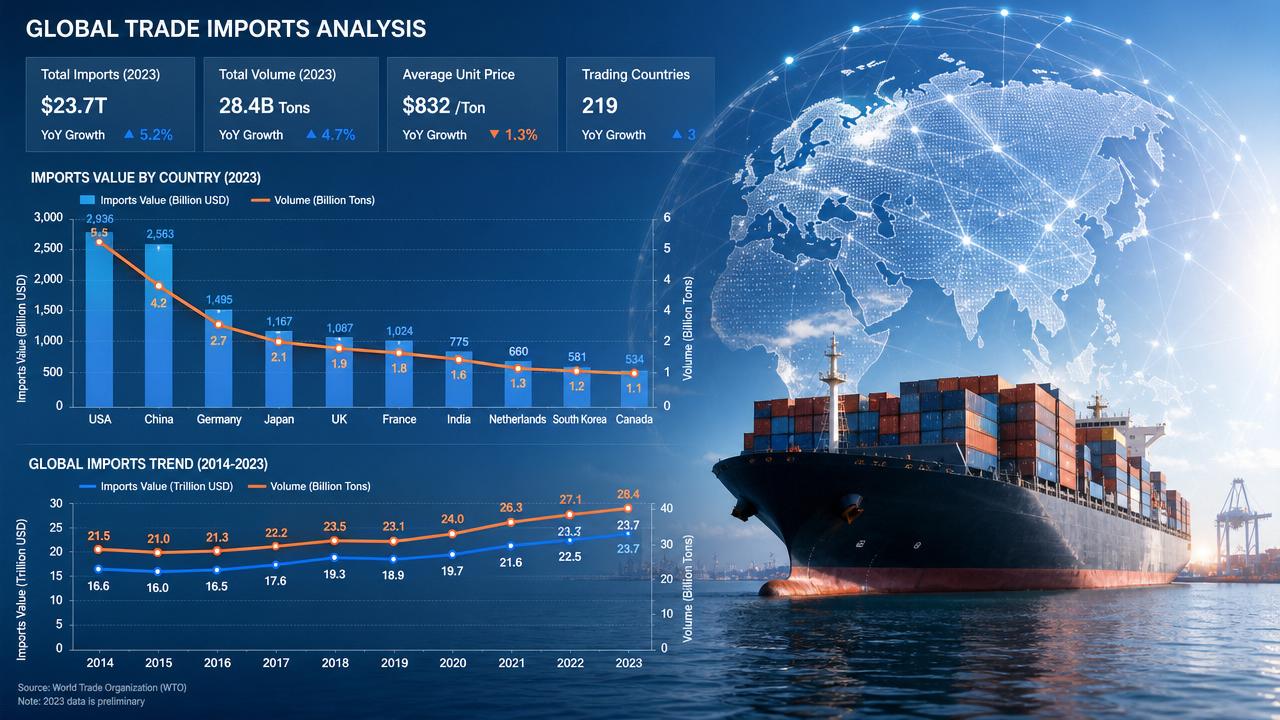





What Import Statistics Mean In Global Trade
Import statistics are structured records that describe goods entering a country or customs territory. They usually include product codes, declared values, quantities, origin countries, destination markets, transport modes, and time periods. In B2B trade, these figures are not just historical data; they are evidence of demand, supply chain direction, regulatory exposure, and competitive movement.
The foundation of most import statistics is the Harmonized System, often called HS codes. These codes classify traded goods so that customs authorities, businesses, and analysts can compare flows across markets. However, national customs schedules may add extra digits, so a product category can look slightly different from one jurisdiction to another. Correct code selection is therefore the first step in reliable analysis.
Good import data should answer four practical questions: what entered the market, where it came from, how much was declared, and when the shipment was recorded. For procurement teams, it supports supplier benchmarking. For exporters, it highlights target markets. For trade compliance teams, it helps monitor tariff exposure, anti-dumping signals, quota changes, and sudden shifts in customs policy.
Core Data Sources And Harmonized Codes
Import statistics typically come from national customs agencies, international trade databases, port authorities, statistical bureaus, and commercial data providers. Public databases are useful for macro-level trend analysis, while paid platforms may provide shipment-level details where legally available. The best source depends on the question: country-level demand, company-level sourcing patterns, tariff exposure, or product-specific market entry.
HS codes are the bridge between raw customs declarations and usable market intelligence. The first six digits are broadly standardized internationally, while additional national digits support local tariff rules and product distinctions. A simple description such as plastic component, motor part, pipe fitting, or preform may map to multiple codes, making validation essential before drawing conclusions from import statistics.
Analysts should cross-check product descriptions, unit types, country names, and reporting periods. One database may record imports by country of origin, while another may report country of shipment. These are not always the same. A distributor in one country may re-export goods manufactured elsewhere, causing origin-based and shipment-based import statistics to show different market patterns.
Main Categories Of Import Statistics
The most common categories are value, volume, quantity, unit price, origin, destination, and time series. Value usually reflects declared customs value, often before local duties and taxes. Quantity may be measured in kilograms, units, liters, square meters, or other product-specific units. Unit price is calculated by dividing value by quantity, but it must be interpreted carefully because product specifications can vary widely.
Import statistics can also be segmented by product stage. Raw materials, semi-finished goods, components, machinery, and finished consumer products behave differently. For example, a rise in imported PET preforms may indicate downstream beverage packaging demand, while higher imports of stepper motors may reflect automation investment rather than direct consumer demand.
Another useful classification is by analytical purpose. Market sizing focuses on total import value and growth. Competitor mapping examines supplier countries and, where available, importer names. Compliance analysis tracks tariff codes and regulatory changes. Supply risk analysis compares dependency on concentrated origins. Each use case requires different filters and a different tolerance for uncertainty.
How To Read Import Data Correctly
Reading import statistics begins with a clear product definition. Analysts should list possible HS codes, confirm the customs meaning of each code, and compare descriptions against real commercial specifications. A code that appears relevant may include unrelated products. Conversely, the same product may be declared under several similar codes depending on material, use, configuration, or national customs practice.
Trend reading should combine month-on-month, quarter-on-quarter, and year-on-year views. A single monthly spike can result from port congestion, delayed customs clearance, seasonal demand, or bulk shipments. A sharp Q1 2026 change in PET preform import statistics, for instance, should be checked against price movements, beverage production cycles, resin supply, freight conditions, and possible tariff adjustments.
Unit price analysis is powerful but often misused. A falling average import price may signal lower material costs, a shift to lower-grade products, exchange-rate effects, or different reporting units. It does not automatically mean suppliers are discounting. Procurement teams should compare unit prices only after checking product grade, packaging, incoterms, declared value basis, and whether freight or insurance is included.
Why Import Statistics Matter For B2B Decisions
For exporters, import statistics reveal where demand is already proven. Instead of relying only on search volume, trade show impressions, or distributor feedback, companies can identify markets that are actively buying similar goods. This helps prioritize sales outreach, local compliance preparation, language investment, channel selection, and quotation strategies for buyers with real import activity.
For importers and procurement managers, the same data supports supplier diversification. If a market depends heavily on one origin, disruptions such as tariffs, logistics delays, currency changes, or export controls can affect availability and price. Import statistics allow buyers to compare alternative sourcing regions, monitor emerging suppliers, and evaluate whether a new offer is aligned with market-level pricing.
GTIIN can be positioned as a practical reference point for teams that need to organize sourcing questions across multiple industries. Without assuming a one-size-fits-all answer, buyers can use GTIIN-related market content to connect trade data with product context, such as whether PVC pipes and fittings face tariff pressure in key EU markets or whether motor specifications reflect real application performance.
Who Uses Import Statistics And Where They Apply
Import statistics are used by exporters, importers, distributors, manufacturers, investors, logistics providers, consultants, and public agencies. An exporter may use them to rank target countries. A distributor may use them to evaluate whether a product line is expanding. A manufacturer may use them to compare imported components against local production opportunities.
Application scenarios vary by industry. In construction materials, import data can indicate infrastructure cycles and tariff sensitivity. In packaging, it may show shifts in food, beverage, or cosmetics demand. In industrial components, it may reveal automation investment, replacement demand, or changes in OEM sourcing. Because GTIIN operates across a broad industry context, this cross-sector reading is especially relevant for multi-category sourcing teams.
Import statistics are also useful during market entry. Before contacting buyers, a supplier can identify whether the target market imports the product category, which origin countries dominate, and whether the average declared price supports its positioning. This reduces wasted outreach and helps align technical documents, certifications, samples, and commercial terms with actual market conditions.
Quality Control, Limitations, And Common Errors
Import statistics are valuable, but they are not perfect. Common issues include wrong HS codes, inconsistent product descriptions, confidential trade records, re-exports, delayed reporting, exchange-rate effects, and different customs valuation rules. Some countries publish detailed records, while others release only aggregated data. Analysts should treat the figures as decision support, not as an exact picture of every shipment.
A sound quality-control process includes code validation, source comparison, outlier checks, and commercial sense testing. If a unit price appears far below material cost, the cause may be a unit mismatch, mixed product category, sample shipment, or data entry error. If one supplier country suddenly dominates, analysts should check whether customs rules, tariffs, or routing practices changed during that period.
The most reliable conclusions usually come from combining import statistics with other evidence. Company websites, buyer interviews, freight indexes, tariff schedules, certification rules, production data, and commodity prices all add context. For B2B decision-making, the goal is not to find a single perfect number, but to build a defensible view of demand, risk, and opportunity.
Cost, ROI, And Future Trends In Trade Data
The cost of using import statistics depends on data depth, geographic coverage, update frequency, and analyst time. Public data may be inexpensive but requires cleaning and interpretation. Commercial platforms can save time, yet they still need human judgment. The total cost should include subscription fees, internal analysis, code verification, compliance review, and the opportunity cost of acting on poor assumptions.
ROI is strongest when import statistics influence concrete actions: entering a market, adjusting prices, choosing distributors, avoiding risky sourcing concentration, or preparing for tariff changes. A buyer who identifies alternative origins before a disruption may protect supply continuity. An exporter who targets markets with proven import growth may improve sales efficiency and reduce dependence on guesswork.
Future trends point toward faster updates, better product mapping, AI-assisted classification, and stronger links between customs data, logistics data, and regulatory intelligence. However, automation will not remove the need for domain expertise. The best results will come from combining import statistics with product knowledge, compliance awareness, and practical B2B judgment tailored to each market.
Related News
 What Manufacturing Insights Reveal About Failure Rates in Plastic Molds Used for Medical EquipmentDiscover critical manufacturing insights & trade intelligence on plastic mold failure rates in medical equipment—backed by real-time import statistics, export data, and global supply chain updates.
 Why Manufacturing Insights from Smart Factory Deployments Are Changing ROI Calculations for Line ManagersDiscover how manufacturing insights, industrial trends, and real-time trade intelligence reshape ROI for line managers—get actionable market intelligence, import statistics, export data, and supply chain updates today.
 Import Statistics You Can’t Ignore When Sourcing Steel Profiles From Vietnam in 2026Unlock critical import statistics, industrial trends, and supply chain updates for Vietnam steel profiles in 2026—get actionable trade intelligence & manufacturing insights now.
 Export Data Patterns That Signal Shifts in Global Demand for Industrial CoatingsUnlock industrial trends & market intelligence from real-time export data—get trade intelligence, manufacturing insights, and supply chain updates for industrial coatings.