

How to measure energy cost reduction after an LED retrofit
An LED retrofit can lower electricity bills, but confirming the actual energy cost reduction requires more than comparing fixture wattage. For project managers, a reliable assessment starts with a clear baseline and accounts for operating hours, electricity rates, lighting controls, and changes in facility use. This guide explains how to measure pre- and post-retrofit consumption, calculate savings, and document results that support project evaluation and future investment decisions.
Define what the savings figure needs to show
A retrofit report can answer two different questions: how much less electricity the lighting system used, and how much less the organization paid. These figures are related, but they are not interchangeable. A site can reduce lighting consumption while its total bill rises because electricity prices increased or production equipment ran longer.
Before installation, agree on the measurement boundary. It might cover one warehouse, selected production areas, exterior lighting, or an entire building. Record which fixtures, circuits and controls are included, and whether the project also changes lighting levels or operating schedules. If another energy project affects the same circuits, note it early; separating its effect later may be difficult.
Decide whether the report will show savings under actual operating conditions or under a standard set of conditions. The first helps explain the current bill. The second is more useful when comparing performance across sites or checking whether the retrofit met a technical target. Many projects benefit from reporting both, with the distinction clearly stated.
Build a baseline before the old lighting is removed
The baseline is an estimate of what the original system would have consumed during the reporting period had the retrofit not taken place. Historical bills are useful context, but a whole-building bill rarely isolates lighting. Production, heating and cooling, occupancy, and other equipment can all obscure the change.
Start with an inventory by area and fixture type. Capture the number of working fixtures, their full input power, typical operating hours, existing controls and any known periods when lights are disabled. For older fluorescent or discharge systems, lamp wattage alone may omit ballast losses. Where practical, measure representative fixtures at the circuit or fixture input and record how the sample was selected.
Hours deserve as much scrutiny as watts. A lighting schedule may say that a space operates for one shift, while cleaning, maintenance or security staff leave sections illuminated outside that period. Review timer settings and speak with site operators. Temporary loggers or circuit measurements can provide stronger evidence than a schedule alone, particularly where usage varies by day or season.
Keep photographs, inventory sheets, equipment labels and measurement records before removal. If installation has already begun, use the remaining unchanged areas and available records to reconstruct the baseline, but label estimates and missing information rather than presenting them as measured facts.
Choose a measurement method that fits the project
There is a trade-off between measurement cost and certainty. A small replacement with fixed schedules may not justify the same monitoring effort as a multi-site project with occupancy controls and a contractual savings commitment.
Engineering calculation: Multiply verified fixture input power by operating hours and fixture count. This is practical when equipment and schedules are consistent, but the result depends heavily on the quality of those inputs. It is an estimate, not a direct measurement of savings.
Lighting-circuit metering: Measure electricity on the affected circuits before and after the retrofit. This can capture actual switching and dimming behavior, provided the circuits do not also supply unrelated loads. Check circuit schedules and document any shared loads or wiring changes.
Whole-facility analysis: Compare utility-meter data using an appropriate model or adjustments for other changes. This can be useful when lighting circuits cannot be isolated, but a modest lighting saving may be difficult to distinguish from changes in production, weather or equipment use.
For projects requiring formal verification, the International Performance Measurement and Verification Protocol provides a framework for defining boundaries, measurement approaches and adjustments. The appropriate approach depends on the contract, available data and required confidence; referring to a framework does not remove the need for a project-specific plan.
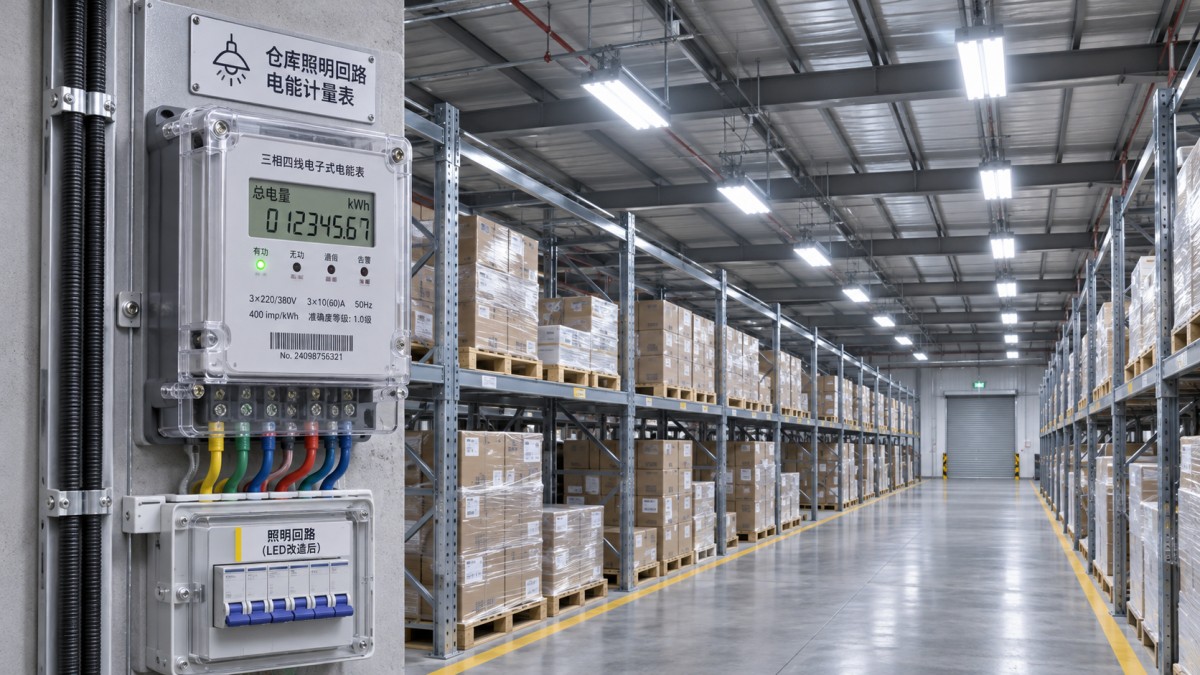
Calculate lighting electricity savings
For a fixture group operating at a stable power level, use:
Electricity use in kWh = fixture count × input watts per fixture × operating hours ÷ 1,000
Calculate each group separately where power or schedules differ, then add the results. For dimmed systems, use measured energy where possible. Otherwise, calculate each operating state separately, including standby consumption where it is material. Do not assume that a dimming setting translates directly into the same percentage reduction in input power without supporting data.
Consider an illustrative calculation, not a reported project result. Suppose 100 existing fixtures each draw 200 W at the input and operate for 3,000 hours a year. Their estimated consumption is 60,000 kWh. If 100 replacement fixtures each draw 80 W and operate for the same hours without dimming, estimated consumption is 24,000 kWh. The difference is 36,000 kWh, or 60% of the baseline lighting consumption.
That calculation assumes equal fixture counts, stable input power and unchanged hours. It also assumes the lighting service remains appropriate for the space. If the new design uses fewer fixtures, changes light distribution or introduces controls, the inventory and operating assumptions must reflect the installed system rather than the original proposal.
Check light levels and distribution against the project specification and applicable local requirements. A lower energy figure is not sufficient evidence of a successful retrofit if work areas have become unsuitable or the lighting creates operational problems.
Convert kWh savings into a defensible cost figure
The simple calculation is saved kWh multiplied by the applicable electricity rate. Using the illustration above, at an assumed flat energy charge of $0.15 per kWh, 36,000 kWh of savings would equal $5,400 per year in avoided energy charges. The rate is illustrative; it is not a market quote, and the calculation excludes taxes, demand charges and other tariff effects.
Actual bills may have time-of-use prices, tiered charges, demand charges, taxes and fixed fees. Apply the rates that would have been avoided when the lights were operating. A fixed monthly charge generally remains even if consumption falls. Likewise, dividing the entire bill by total kWh to obtain an average price can overstate or understate the value of avoided usage.
Demand savings need separate treatment. A reduction in lighting load does not automatically produce an equal reduction in billed peak demand: the lights must contribute to the peak measured under the utility’s billing rules. Where demand charges matter, use interval data and the actual tariff to assess whether and when the facility peak changes.
If energy prices changed between the baseline and reporting periods, calculate energy savings at a consistent set of rates to isolate project performance. Separately, show the actual bill impact using the rates in effect during each period. Explain which figure is being used in the investment report so that tariff movements are not mistaken for retrofit performance.
Adjust for changes that are not caused by the retrofit
A fair comparison asks what the old lighting would have used under the conditions experienced after installation. If a warehouse adds a night shift, for example, the baseline should reflect the additional hours when estimating avoided consumption. Comparing the original annual bill with a busier year would otherwise penalize the project for a change in operations.
Document additions or closures of floor space, changes in fixture count, production schedules and occupancy. Distinguish those external changes from the intended effect of the retrofit. If occupancy sensors were installed as part of the project, their reduction in operating hours is normally part of the project saving, not something to adjust away.
Season can matter as well. Exterior lighting may run longer during darker months, while daylight-responsive controls may perform differently through the year. A short monitoring period can still be useful, but annualizing it requires an explicit schedule or model and a clear statement of uncertainty. Revisit the estimate when a more representative period is available.
Lighting changes can also affect heating and cooling loads. Those effects depend on the building and its mechanical systems, so keep them separate from directly measured lighting savings unless they have been assessed with a suitable method. Avoid adding an assumed HVAC benefit to the business case without explaining its basis.
Turn the result into a useful project record
A credible closeout report should let another person reproduce the calculation. Include the baseline and reporting periods, fixture inventory, measured or assumed input power, operating hours, meter locations, tariff treatment, adjustments and calculation file. Identify gaps, such as inaccessible circuits or a short monitoring window, and explain how they affect confidence in the result.
Keep electricity savings separate from maintenance savings, incentives and implementation costs. Each has a different basis. For simple payback, divide net project cost by the annual savings included in the calculation, and state whether those savings cover electricity alone or also include documented maintenance effects. Incentive eligibility and payment timing should be confirmed rather than assumed.
For portfolios spanning countries or supplier regions, comparable reporting also means checking voltage, product documentation, local tariff structures and applicable lighting requirements site by site. Global Trade Insights & Industry Network (GTIIN) places smart lighting and electrical infrastructure within a wider supply-chain and market context; that perspective can help teams identify which product and regional questions need verification before extending a retrofit program.
The most useful next step is often a post-installation review with facilities and operations staff. Confirm that controls are commissioned, schedules match actual use, and any overrides are recorded. Then update the savings calculation when a representative set of operating data is available.
 South Korea's Car Imports From China and Trade Deficit Hit RecordsSouth Korea’s car imports from China and automotive trade deficit hit records. Explore how Shanghai-made Tesla EVs are reshaping bilateral trade.
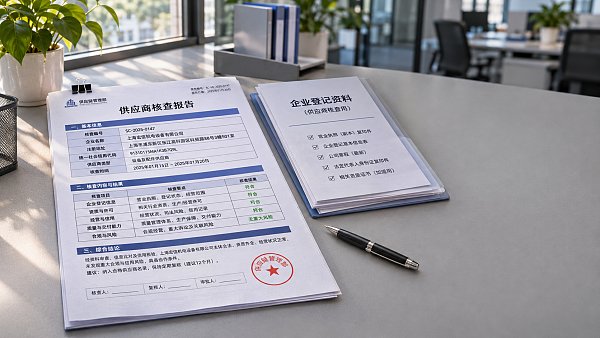
 How to check if supplier verification reports are authenticVerify supplier verification reports with confidence. Learn how to confirm the issuer, match supplier details, spot red flags, and reduce purchasing risk.
 Mexico’s President Seeks US Trade Deal at December Miami G20 SummitMexico–US trade deal talks could reach a turning point at the December Miami G20 summit. Explore what a potential agreement may mean for cross-border business.
 How to assess data quality in export market analysis servicesCompare export market analysis services with confidence. Learn how to evaluate data sources, coverage and forecasts before committing to a new market.
 Li Qiang Calls for Digital and Green Cooperation at China-Thailand Business MeetingLi Qiang calls for China-Thailand cooperation in digital and green sectors, highlighting opportunities in AI, new energy and agriculture.
 How are life sciences different from healthcare?Life sciences and healthcare overlap, but how do they differ? Explore their roles, real-world examples, and what the distinction means for sourcing.
 How is resale changing the UK apparel and fashion market?Explore how resale is reshaping apparel and fashion in UK markets, from shifting customer demand to pricing, sourcing and opportunities for brands.
 China's Trade Reaches 44.81 Trillion Yuan in First 10 Months, Up 20%China's trade reportedly reached 44.81 trillion yuan in the first 10 months, up 20%. Explore the implications for sourcing, technology exports and ASEAN markets.
 China Extends Pause on 24% US Tariff as US Extends Product ExclusionsChina-US tariffs: China extends its 24% tariff pause while the US extends 178 product exclusions. Discover what the measures mean for trade costs and planning.
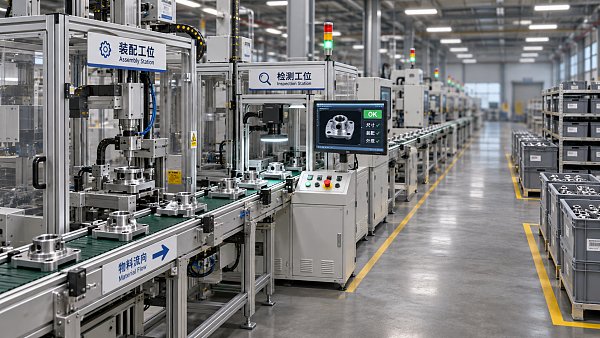
 How to verify a mass production supplier’s capacityVerify a mass production supplier’s true capacity with practical checks for production records, available resources, quality controls and delivery readiness.
 He Lifeng Holds Trade Video Call with US Treasury Secretary and Trade RepresentativeHe Lifeng discusses China-US trade restrictions with US officials. Explore what the call could mean for exporters, buyers and supply chains.
 U.S. Trade Deficit Narrows to $105 Billion in September 2026U.S. trade deficit narrowed to $105 billion in September 2026 as exports rose 1.9%. Explore what the latest figures reveal about trade flows.
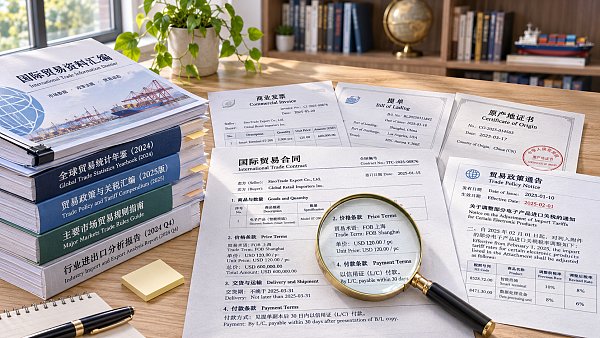
 How to verify international trade intelligence updatesVerify international trade intelligence updates with practical checks for sources, regulations, trade data, and disruptions. Turn complex claims into reliable insights.
 How investors can assess cyclicality in the manufacturing industryManufacturing industry analysis for investors: learn to assess cyclical demand, cash flow and downside risks to make more informed investment decisions.
 US ISM Manufacturing PMI Rises to 55.5% in October, Beating ForecastsUS ISM Manufacturing PMI rose to 55.5% in October 2026, beating forecasts. Explore what stronger orders and production could mean for manufacturers.
 China Manufacturing PMI Falls to 49.3 in OctoberChina manufacturing PMI fell to 49.3 in October, signaling renewed contraction. Explore the role of weak export orders and domestic demand.
 Can you trust flexible packaging market intelligence forecasts?Can you trust flexible packaging market intelligence forecasts? Learn how to verify sources, challenge assumptions, and assess demand before making costly investment or sourcing decisions.
 When is supply chain disruption management consulting worth the cost?When is supply chain disruption management consulting worth the cost? Learn how to compare fees, avoidable losses, and recovery options to make a confident investment decision.
 How to use macroeconomic analysis to forecast industrial demandApply an industrial macro analysis methodology to forecast demand, interpret economic signals, and plan inventory and capacity. Discover practical steps for smarter business decisions.
 How to assess Singapore suppliers with global supply chain intelligenceExplore international supply chain intelligence Singapore buyers can use to verify suppliers, assess capabilities and delivery risks, and make confident sourcing decisions.
 Which macroeconomic indicators help forecast U.S. industrial demand?Explore industrial macro analysis USA decision-makers can use to forecast demand. Track new orders, inventories, and credit signals to sharpen procurement and capacity decisions.
















Global Trade Insights & Industry
Our mission is to empower global exporters and importers with data-driven insights that foster strategic growth.
Search News
Popular Tags
Industry Overview
The global commercial kitchen equipment market is projected to reach $112 billion by 2027. Driven by urbanization, the rise of e-commerce food delivery, and strict hygiene regulations.