

How to interpret accuracy specifications for measuring instruments
An instrument’s stated accuracy is meaningful only when its reference value, measurement range, resolution, and operating conditions are clear. A specification of ±0.5% of reading produces a different error limit from ±0.5% of full scale, especially near the bottom of a range. Digital instruments may also add a count term tied to the displayed resolution.
To assess whether an instrument is suitable, calculate the permitted error at the actual measurement point and compare it with the tolerance available for the measurement task. Then establish whether the calculation covers the complete measurement system, calibration status, and conditions at the point of use.
Start with the reference behind the percentage
A percentage alone does not define an accuracy limit. The datasheet must say what the percentage applies to. The distinction matters because the same numerical percentage can produce very different absolute limits as the measured value changes.
- Percentage of reading: The percentage is applied to the indicated or measured value. The absolute error term decreases as the reading decreases.
- Percentage of full scale: The percentage is applied to the full-scale value or span defined by the manufacturer. The resulting absolute limit is generally constant across that range.
- Percentage of span: The reference is the difference between the upper and lower range limits. For a range that does not start at zero, span and upper range value are different quantities.
- Percentage of range: This wording requires the manufacturer’s definition; it should not automatically be treated as a percentage of reading.
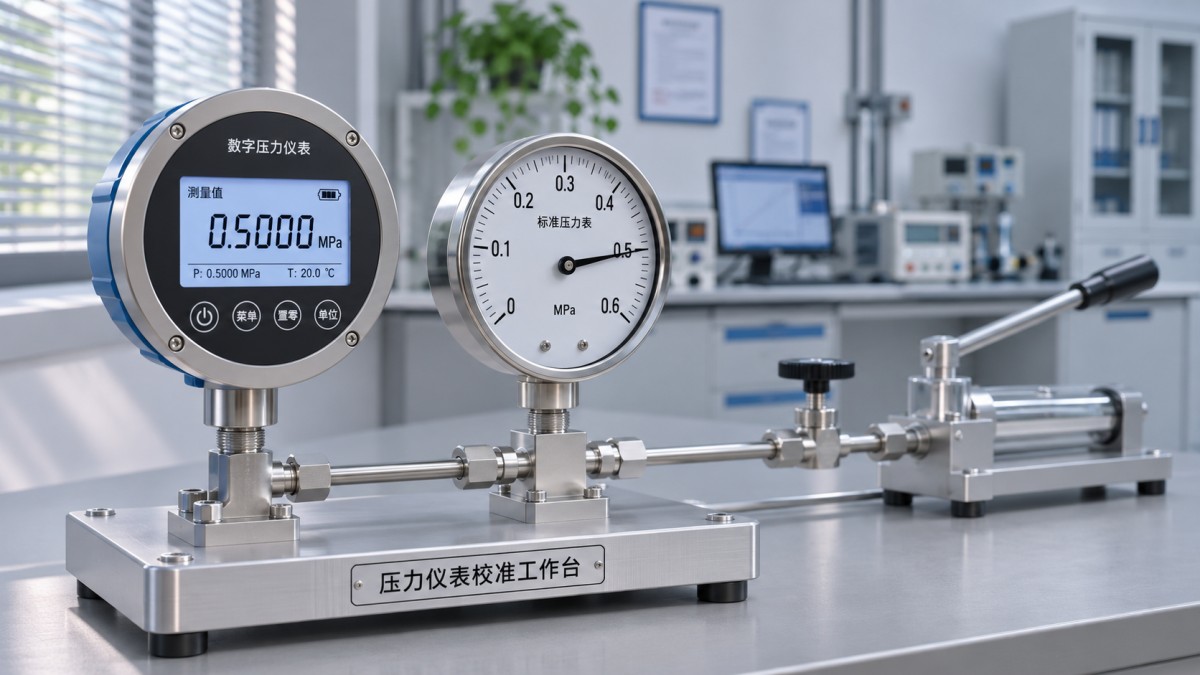
Consider a pressure instrument with a range of 0 to 100 bar and a reading of 20 bar. A limit of ±0.5% of reading gives ±0.1 bar. A limit of ±0.5% of full scale gives ±0.5 bar. At 100 bar, both calculations give ±0.5 bar, so comparing instruments only at the top of the range hides the difference at lower pressures. These figures illustrate the arithmetic; they are not performance claims for a particular instrument.
For a range of −20 to 80 °C, the span is 100 °C. A specification based on that span uses 100 °C as its reference, not the upper limit of 80 °C. Confirm how the manufacturer defines full scale and span, particularly for ranges that cross zero or have a suppressed zero.
Read combined specifications as an equation
Digital meters often express accuracy as a reading-dependent term plus a number of counts, sometimes called digits. For example, suppose a voltage meter displays 12.34 V on a range with a resolution of 0.01 V, and its stated limit is ±(0.5% of reading + 2 counts).
The reading term is 0.005 × 12.34 V = 0.0617 V. Two counts contribute 2 × 0.01 V = 0.02 V. Adding the specified terms gives a limit of ±0.0817 V, commonly rounded to approximately ±0.082 V for reporting. The indicated 12.34 V therefore corresponds to an interval of approximately 12.258 V to 12.422 V under the stated specification conditions.
The count term refers to increments of the least significant displayed digit under the manufacturer’s definition. It does not necessarily mean that the final two decimal digits are uncertain. If the meter changes range and the display increment becomes 0.1 V, the same two-count term becomes 0.2 V. Autoranging can therefore change the applicable error limit even when the measured quantity changes only slightly.
Use the formula and combination rule stated in the datasheet. A specification written as a sum calls for adding those terms as directed; combining them statistically would produce a different result and is not justified simply because both are error contributions. Also confirm whether the specification applies to the selected function, such as DC voltage, AC voltage, resistance, or frequency. Different functions often have separate limits and operating restrictions.
Resolution, repeatability, and accuracy describe different behavior
Resolution is the smallest displayed increment or stated output step. A display that shows 12.345 V does not establish that the last digit is accurate. The accuracy limit may be much wider than one display increment, and a stable final digit does not prove the absence of a systematic offset.
Repeatability describes the closeness of results under stated repeated-measurement conditions. A sensor can repeat the same biased result consistently; conversely, a sensor with a small average bias can show substantial scatter. Hysteresis adds another distinction: at the same input, the output can differ according to whether the input approached that point from above or below. This matters when pressure cycles, temperature ramps, or mechanical loading change direction.
Datasheets also use linearity, zero error, and span error. Read their definitions before adding them to a headline accuracy figure. A stated accuracy may already include some of these effects, while a separate term may apply under a different condition. Adding every number on the page can double-count an effect; omitting an excluded term can understate the limit.
Determine when the stated limit applies
Accuracy specifications are conditional. The relevant conditions are often in footnotes, function tables, or calibration sections rather than beside the headline figure. Identify the range, input level, environmental limits, warm-up time, and calibration interval associated with the specification.
Temperature coefficients are a frequent source of overlooked error. A datasheet may specify accuracy within a reference temperature band and add an error per degree outside it. Apply that extra term only over the portion of ambient temperature outside the stated band, using the manufacturer’s formula. Sensor temperature, instrument ambient temperature, and process temperature are separate quantities; the coefficient must be applied to the variable identified in the specification.
Electrical conditions also matter. For AC measurements, accuracy can vary with frequency, waveform, and signal level. A meter specified for sinusoidal signals within a stated frequency band cannot be assumed to retain the same limit for a distorted waveform outside its crest-factor or bandwidth conditions. Input impedance and loading can change the circuit being measured, creating an error that is not captured by the display specification alone.
For pressure and temperature systems, installation affects the result. Pressure taps, impulse lines, trapped gas or liquid, and elevation differences can create offsets between the process point and the sensing element. A temperature probe can conduct heat along its stem or sit too close to a vessel wall, causing the sensing element to differ from the temperature of interest. These are measurement-system effects, even if the instrument itself meets its bench specification.
Separate the instrument limit from measurement uncertainty
A manufacturer’s accuracy specification is a performance limit under stated conditions. Measurement uncertainty expresses the dispersion of values reasonably attributable to a measurand, using an uncertainty model and an identified level of coverage where applicable. The two quantities are related, but a ± accuracy limit should not automatically be reported as an expanded uncertainty with a particular confidence level.
A measurement uncertainty budget can include the reference standard, calibration results, instrument resolution, repeatability, environmental effects, and the measurement method. Each contribution needs a defined basis. Where contributions are treated statistically, their distributions and correlations determine how they are combined; an accuracy limit alone does not establish those details.
For a bounded acceptance calculation, a conservative approach is to add applicable worst-case limits when their simultaneous occurrence is plausible and the governing procedure calls for it. For an uncertainty budget, follow the applicable measurement procedure and document the assumptions. Neither approach justifies adding a sensor’s specification again if a calibrated complete-system result already includes that contribution under the relevant conditions.
Use calibration results without overstating them
Calibration compares an instrument or measurement system with a reference and reports results for specified points and conditions. A certificate can show a correction, an uncertainty, and sometimes a conformity statement. It does not, by itself, prove that every point across the range meets the manufacturer’s specification or that performance remains unchanged until the next calibration.
Examine whether the calibration points bracket the values used in service. A sensor calibrated only near full scale provides limited evidence about performance near the bottom of its range. For a system with hysteresis, results from both increasing and decreasing inputs can reveal behavior that a single-direction sequence misses. Record the range, sensor, transmitter, display, and configuration covered by the calibration: replacing a probe or changing signal scaling can invalidate a result for the assembled system.
A reported correction can reduce known bias when it is applied consistently and remains appropriate at the measurement point. The uncertainty associated with that correction still matters. Interpolation between calibration points requires a defensible method, especially where nonlinearity or abrupt range changes are significant. Drift between calibrations is a separate contribution that must be assessed from available evidence or controlled through the calibration interval.
Compare the calculated limit with the task tolerance
Suppose a process limit requires a pressure measurement within ±0.3 bar at 20 bar. In the earlier example, the ±0.5% of reading specification gives an instrument limit of ±0.1 bar at that point, while ±0.5% of a 100 bar full scale gives ±0.5 bar. On those figures alone, the first instrument leaves room for additional effects; the second exceeds the stated allowance before installation or calibration contributions are considered.
That comparison only holds if the accuracy specifications apply to the selected range and conditions, and if ±0.3 bar is truly the allowance for measurement error. A product tolerance and an instrument error allowance are not automatically the same. The acceptance rule must also establish how measurements near a limit are treated. A guard band, for example, narrows the acceptance zone to account for measurement uncertainty; its width follows the chosen decision rule rather than a universal formula.
When reviewing competing datasheets, calculate limits at the low, normal, and high values that matter to the task. Include range changes and any extra terms for temperature, frequency, or time since calibration. If a specification omits the reference for a percentage, the meaning of a count, or whether a sensor is included, the comparison remains unresolved until that definition is supplied.
 South Korea's Car Imports From China and Trade Deficit Hit RecordsSouth Korea’s car imports from China and automotive trade deficit hit records. Explore how Shanghai-made Tesla EVs are reshaping bilateral trade.
 How to check if supplier verification reports are authenticVerify supplier verification reports with confidence. Learn how to confirm the issuer, match supplier details, spot red flags, and reduce purchasing risk.
 Mexico’s President Seeks US Trade Deal at December Miami G20 SummitMexico–US trade deal talks could reach a turning point at the December Miami G20 summit. Explore what a potential agreement may mean for cross-border business.
 How to assess data quality in export market analysis servicesCompare export market analysis services with confidence. Learn how to evaluate data sources, coverage and forecasts before committing to a new market.
 Li Qiang Calls for Digital and Green Cooperation at China-Thailand Business MeetingLi Qiang calls for China-Thailand cooperation in digital and green sectors, highlighting opportunities in AI, new energy and agriculture.
 How are life sciences different from healthcare?Life sciences and healthcare overlap, but how do they differ? Explore their roles, real-world examples, and what the distinction means for sourcing.
 How is resale changing the UK apparel and fashion market?Explore how resale is reshaping apparel and fashion in UK markets, from shifting customer demand to pricing, sourcing and opportunities for brands.
 China's Trade Reaches 44.81 Trillion Yuan in First 10 Months, Up 20%China's trade reportedly reached 44.81 trillion yuan in the first 10 months, up 20%. Explore the implications for sourcing, technology exports and ASEAN markets.
 China Extends Pause on 24% US Tariff as US Extends Product ExclusionsChina-US tariffs: China extends its 24% tariff pause while the US extends 178 product exclusions. Discover what the measures mean for trade costs and planning.
 How to verify a mass production supplier’s capacityVerify a mass production supplier’s true capacity with practical checks for production records, available resources, quality controls and delivery readiness.
 He Lifeng Holds Trade Video Call with US Treasury Secretary and Trade RepresentativeHe Lifeng discusses China-US trade restrictions with US officials. Explore what the call could mean for exporters, buyers and supply chains.
 U.S. Trade Deficit Narrows to $105 Billion in September 2026U.S. trade deficit narrowed to $105 billion in September 2026 as exports rose 1.9%. Explore what the latest figures reveal about trade flows.
 How to verify international trade intelligence updatesVerify international trade intelligence updates with practical checks for sources, regulations, trade data, and disruptions. Turn complex claims into reliable insights.
 How investors can assess cyclicality in the manufacturing industryManufacturing industry analysis for investors: learn to assess cyclical demand, cash flow and downside risks to make more informed investment decisions.
 US ISM Manufacturing PMI Rises to 55.5% in October, Beating ForecastsUS ISM Manufacturing PMI rose to 55.5% in October 2026, beating forecasts. Explore what stronger orders and production could mean for manufacturers.
 China Manufacturing PMI Falls to 49.3 in OctoberChina manufacturing PMI fell to 49.3 in October, signaling renewed contraction. Explore the role of weak export orders and domestic demand.
 Can you trust flexible packaging market intelligence forecasts?Can you trust flexible packaging market intelligence forecasts? Learn how to verify sources, challenge assumptions, and assess demand before making costly investment or sourcing decisions.
 When is supply chain disruption management consulting worth the cost?When is supply chain disruption management consulting worth the cost? Learn how to compare fees, avoidable losses, and recovery options to make a confident investment decision.
 How to use macroeconomic analysis to forecast industrial demandApply an industrial macro analysis methodology to forecast demand, interpret economic signals, and plan inventory and capacity. Discover practical steps for smarter business decisions.
 How to assess Singapore suppliers with global supply chain intelligenceExplore international supply chain intelligence Singapore buyers can use to verify suppliers, assess capabilities and delivery risks, and make confident sourcing decisions.
 Which macroeconomic indicators help forecast U.S. industrial demand?Explore industrial macro analysis USA decision-makers can use to forecast demand. Track new orders, inventories, and credit signals to sharpen procurement and capacity decisions.





















Global Trade Insights & Industry
Our mission is to empower global exporters and importers with data-driven insights that foster strategic growth.
Search News
Popular Tags
Industry Overview
The global commercial kitchen equipment market is projected to reach $112 billion by 2027. Driven by urbanization, the rise of e-commerce food delivery, and strict hygiene regulations.