

When does a global trade intelligence dashboard improve market entry decisions?
Entering a new market often begins with an apparently simple question: “Where should we sell next?” For an enterprise decision-maker, the real question is much harder. Is demand durable or temporary? Can the product clear local requirements? Are suppliers, freight routes, distributors, and payment conditions stable enough to support a launch? And will the opportunity still be attractive after tariffs, certification work, inventory exposure, and local competition are considered?
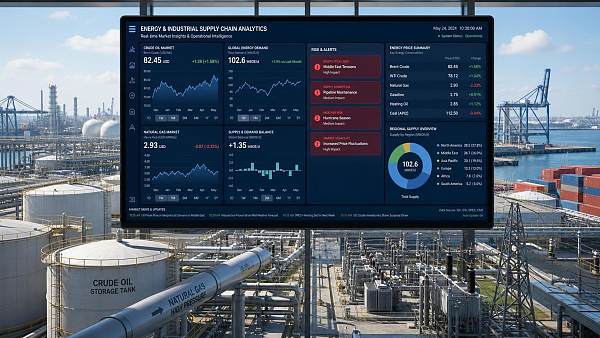
A global trade intelligence dashboard improves market entry decisions when these questions cannot be answered reliably through isolated reports, personal contacts, or last year’s sales assumptions. Its value is not in displaying more charts. It lies in bringing commercial, operational, and regulatory signals into one decision context, so leaders can distinguish a promising market from one that merely looks promising at first glance.
For companies operating across manufacturing, industrial equipment, electronics, green energy, consumer goods, food systems, healthcare, chemicals, construction materials, or logistics, that distinction can shape where capital, management attention, and inventory are committed.
Market entry becomes difficult when the evidence is fragmented
Most companies do not lack information. They lack a usable view of information.
A commercial team may see growing inquiries from a country and interpret them as a demand signal. Procurement may see rising input costs from the same region. The compliance team may be tracking a new product standard, while logistics reports congestion on a critical shipping corridor. None of these observations is necessarily wrong. The problem emerges when they are reviewed separately, too late, or without a shared view of their combined business impact.
This is where international expansion plans can become vulnerable. A market with visible demand may still be unsuitable for immediate entry if local certification timelines are long, distributor margins are unclear, port conditions are unstable, or product specifications need redesign. Conversely, a market that appears modest in broad macroeconomic reports may offer a practical opening because competitor supply is constrained, industrial investment is rising, or buyers are actively seeking alternative sources.
A global trade intelligence dashboard is most useful when it turns disconnected developments into a comparable market-entry picture. Rather than asking teams to react to dozens of separate updates, it helps them assess how demand, policy, supply conditions, pricing, and logistics interact.
The moments when a dashboard materially changes the decision
Not every market decision requires a sophisticated intelligence platform. A company renewing business with a long-standing customer in a familiar country may need only targeted commercial and compliance checks. The dashboard becomes more valuable when uncertainty is high, the financial commitment is meaningful, or the market has several moving parts.
When the company is choosing between several possible countries
Expansion discussions often narrow too quickly around the largest market, the market with the most inbound inquiries, or the one preferred by a senior distributor. Those factors matter, but they do not establish market readiness.
A structured dashboard supports a more balanced comparison. Leaders can review category demand, import and export patterns, local production capacity, supplier concentration, relevant trade rules, freight exposure, and signs of buyer preference. For a machinery manufacturer, this may mean comparing industrial upgrading activity, local service expectations, component availability, and end-user investment cycles. For a food exporter, the evaluation may focus more heavily on cold chain capacity, labeling rules, food safety requirements, and retail channel structure.
The purpose is not to identify a universally “best” country. It is to identify the market that best fits the company’s product, compliance readiness, operating model, and acceptable level of risk.
When demand appears strong but its quality is uncertain
Trade volumes and online inquiries can create false confidence. They do not automatically reveal whether demand is recurring, price-driven, project-based, seasonal, or dependent on a narrow set of buyers.
Consider a supplier of energy storage components receiving increased interest from a rapidly developing market. A dashboard that connects import movement with grid investment, local policy direction, competing technologies, and supply chain conditions can help management ask better questions: Is the demand linked to a temporary subsidy? Are projects concentrated among a few contractors? Does the market require local technical support? Are buyers prioritizing price, warranty terms, or specific certifications?
That level of interpretation matters because market entry is rarely justified by volume alone. Decision-makers need to understand the durability and accessibility of demand.
When regulations can alter the economics of entry
Regulatory requirements are often treated as a final pre-launch task. In reality, they may determine whether the market is commercially viable at all. Customs classifications, tariffs, product registration, testing procedures, environmental rules, safety standards, packaging obligations, and documentation requirements can affect cost, lead time, product design, and channel selection.
A useful trade intelligence environment does more than announce that a rule has changed. It connects the change to affected categories and prompts teams to review practical consequences. A medical device company may need to examine registration pathways and documentation responsibilities. A building material exporter may need to reassess fire, sustainability, or installation standards. An electronics supplier may need to confirm whether changing technical rules affect components, labeling, or conformity assessment.
The earlier these issues are seen, the more options the business retains. Products can be adapted before production is committed. Market-entry sequencing can change. Local partners can be evaluated based on their regulatory capability rather than sales reach alone.
When supply chain resilience matters as much as sales potential
A new market may look attractive on a commercial forecast while being difficult to serve consistently. This is especially important for businesses selling equipment with spare-part requirements, temperature-sensitive food products, high-value electronics, bulky construction materials, or goods affected by volatile freight conditions.
Leaders need visibility beyond the factory gate: trade corridors, port and warehouse capacity, transit reliability, customs friction, regional disruption, and alternative routes. They also need to understand whether local inventories, repair capability, and service partners are sufficient for the customer promise being made.
For example, a distributor considering a new agricultural equipment line may see strong seasonal demand. Yet if replacement parts cannot reach dealers quickly during planting or harvest periods, the reputation cost may outweigh early sales gains. In such cases, a dashboard improves the decision by making operational fragility visible before the launch plan is approved.
What information should be connected before approving market entry?
The strongest dashboards are not simply data warehouses. They organize information around the decisions business teams actually need to make. For market entry, five connected lenses are especially important.
- Demand and category momentum: Look beyond headline market size. Review changes in purchasing activity, sector investment, buyer requirements, product substitution, and the difference between broad interest and reachable demand.
- Competitive and supply-side conditions: Identify local manufacturers, established import sources, supplier concentration, price pressure, technical differentiation, and whether buyers are seeking alternatives to current suppliers.
- Regulatory and compliance exposure: Map product-specific standards, tariff developments, customs procedures, certification needs, restricted materials, labeling, environmental obligations, and likely documentation burdens.
- Logistics and delivery viability: Assess freight corridors, transit risk, warehouse options, cold chain or special handling needs, spare-parts availability, and the cost of maintaining service levels.
- Commercial execution conditions: Consider distributor capability, payment norms, local tender practices, after-sales expectations, language requirements, and the investment required to build credibility.
These lenses should not be evaluated as a checklist with equal weight in every case. A chemical materials producer may place compliance and transport controls at the center of its assessment. A consumer goods brand may prioritize channel fit, local preferences, and inventory turnover. An industrial automation supplier may give greater weight to technical sales capability and system-integration partners.
A dashboard should support judgment, not replace it
Senior leaders sometimes hesitate to adopt a new intelligence tool because dashboards can create an illusion of certainty. That concern is valid. Data does not remove ambiguity from international trade; it helps companies locate the ambiguity more precisely.
A global trade intelligence dashboard should therefore be used as a decision framework, not an automated approval mechanism. It can highlight that demand is increasing, but management still needs to test whether its own offer is competitive. It can flag new regulatory exposure, but specialists must determine the precise legal and technical response. It can show a potential distributor’s market relevance, but commercial teams must still evaluate commitment, reputation, and strategic alignment.
The right outcome is not “the dashboard says enter.” A better outcome is: “We understand the opportunity, the conditions required for success, the risks we are accepting, and the signals that would tell us to pause or adjust.”
How GTIIN can make the evaluation more practical
Global Trade Insights & Industry Network (GTIIN) is designed for this type of cross-functional market assessment. Its coverage spans more than 50 industrial and commercial categories, including machinery, electronics, green energy, agriculture and food, healthcare, chemicals, metals, construction, consumer goods, logistics, security, hospitality supplies, and business services.
That breadth matters because entry decisions are rarely contained within one product category. A manufacturer of pumps or valves may need to understand infrastructure demand, water treatment investment, local industrial activity, material standards, and procurement expectations. A producer of photovoltaic equipment may need visibility into energy policy, grid development, component supply, project pipelines, and logistics conditions. A home and garden exporter may need a clearer view of retail trends, packaging requirements, seasonal demand, and regional sourcing competition.
GTIIN’s role is to organize these market signals into usable business context. Instead of presenting regulation, freight, buyer behavior, production capacity, and pricing movement as unrelated updates, the platform helps users consider how changes may affect particular industries, product categories, suppliers, and market-entry plans.
For executive teams, this can reduce the common gap between strategic ambition and operational preparation. The commercial case for a market can be discussed alongside the practical work required to serve it.
Questions to ask before selecting a trade intelligence platform
Decision-makers evaluating a dashboard should avoid choosing one solely because it offers extensive coverage or visually polished reporting. The more relevant question is whether the platform makes the next decision easier to defend.
Start by asking whether information is sufficiently category-specific. Broad country reports are useful for orientation, but a company exporting medical consumables, industrial fasteners, recycled polymers, or cold chain equipment needs insight tied to its actual commercial environment.
Next, assess whether the platform connects updates to business implications. A policy notice without an explanation of affected products or likely operational consequences creates more work for the user. Strong intelligence should help teams identify what requires review, who should be involved, and how urgent the issue may be.
It is also worth examining whether the information can be compared across functions. Sales, sourcing, compliance, finance, and logistics should not be operating from competing versions of market reality. A dashboard is more useful when it supports a common planning conversation rather than becoming another specialist tool used in isolation.
Finally, consider timeliness and interpretive quality. In fast-moving markets, outdated information can be more damaging than incomplete information. Yet speed alone is not enough. Leaders need a source that separates meaningful developments from background noise and places them in an understandable industry context.
Common mistakes that weaken dashboard-led decisions
One mistake is treating import growth as proof of opportunity. Imports may rise because of temporary stockbuilding, a one-off project, a policy deadline, or supply shortages that will soon normalize. Market signals should be checked against sector conditions and buyer behavior.
Another is focusing on a single favorable factor. Low tariffs do not compensate for weak distribution. High demand does not eliminate certification delays. A convenient port does not guarantee a reliable local service model. Market entry succeeds when the critical conditions work together, not when one indicator looks impressive.
Companies also sometimes collect intelligence without assigning decision ownership. If no one is responsible for translating a regulatory alert into an action, or for testing whether a logistics risk changes inventory policy, the dashboard becomes a passive news feed. Clear review routines are essential.
Finally, avoid assuming that one country strategy can be copied directly into another. Even neighboring markets may differ sharply in procurement culture, technical expectations, price sensitivity, channel power, and regulatory practice.
From information gathering to a market-entry decision
The most valuable use of a global trade intelligence dashboard occurs before a company has committed heavily—before large inventory orders, a distributor appointment, a local entity, or a marketing launch makes changing course expensive.
At that stage, leadership can use the dashboard to frame a disciplined decision: Which market has the strongest fit? What must be validated before entry? What investments are necessary to meet buyer expectations? Which risks can be mitigated, and which should lead the company to defer or redesign the plan?
Global trade will remain complex. Demand shifts, policy changes, supply disruptions, and buyer expectations will continue to overlap in ways that are difficult to read from a single report or conversation. Companies do not need perfect foresight to enter new markets well. They need a clearer, shared understanding of the conditions they are entering.
That is when a global trade intelligence dashboard becomes more than a reporting tool: it becomes a practical part of market-entry governance, helping decision-makers move with confidence while keeping their eyes open.
- industrial automation
- industrial equipment
- food safety
- cold chain
- global trade
- procurement
- water treatment
- trade intelligence
- trade insights
- supply chain
- global trade intelligence
- global trade insights
- chemical materials
- home and garden
- green energy
- business services
- trade intelligence platform
- construction materials
- supply chain resilience
- medical consumables
- consumer goods
- global trade intelligence dashboard
 How an industrial trade intelligence dashboard can identify new supplier marketsDiscover how an industrial trade intelligence dashboard helps identify new supplier markets by comparing capacity, landed cost, logistics resilience, and compliance risk.
 Which global market entry barriers should exporters assess first?Global market entry barriers exporters should assess first: tariffs, compliance, buyer qualification, logistics, and payment risk. Build a practical strategy for confident market entry.
 How trade data aggregation analytics can reveal emerging supplier marketsTrade data aggregation analytics reveals emerging supplier markets by connecting trade flows, capacity signals, logistics, and compliance insights for smarter sourcing decisions.
 When an export market analysis platform can validate demand in a new marketExport market analysis platform insights help validate new-market demand through buyer fit, regulations, logistics, competition, and profitable entry conditions.
 What is driving the beauty and personal care market in the USA?Beauty and personal care in USA is driven by targeted solutions, selective premiumization, digital discovery, clean-label trust, diverse needs, and compliance. Explore key growth opportunities.
 How trade flow monitoring reports reveal changing regional demandTrade flow monitoring reports reveal changing regional demand through import volumes, sourcing shifts, product mix, logistics signals, and regulatory trends. Explore actionable market insights.
 How international market intelligence for investors reduces market-entry riskInternational market intelligence for investors reduces market-entry risk by validating demand, regulations, logistics, and competition before capital is committed.
 How international sourcing intelligence helps identify supplier risk earlyInternational sourcing intelligence helps businesses spot supplier risks early, protect supply continuity, and make smarter global procurement decisions.
 How trade data aggregation analytics reveals emerging supplier marketsTrade data aggregation analytics reveals emerging supplier markets through export trends, input flows, logistics, and regulatory signals. Discover smarter sourcing insights.
 What industrial cluster monitoring in Vietnam reveals about site riskIndustrial cluster monitoring Vietnam reveals hidden site risks across labor, utilities, logistics, compliance, and supplier dependencies. Make smarter sourcing and expansion decisions.
 Food Technology Trends Reshaping Shelf Life, Safety, and Product InnovationFood technology is reshaping shelf life, safety, and innovation. Discover the trends helping food businesses cut risk, improve compliance, and unlock stronger global market growth.
 How electronics manufacturing services are changing with low-volume demandElectronics manufacturing services are evolving fast with low-volume demand. Learn how agile EMS partners improve flexibility, compliance, sourcing resilience, and speed to market.
 How Can Buyers Reduce Procurement Risks for Electronic Components?How to reduce procurement risks for electronic components: learn how buyers assess traceability, lead times, compliance, and supplier types to avoid costly sourcing mistakes.
 What Sourcing Intelligence India Reveals About Supplier Risk and Cost ShiftsSourcing intelligence India reveals hidden supplier risk, compliance gaps, logistics pressure, and real cost shifts—helping buyers compare vendors smarter and source with more confidence.
 Fashion Trends 2026: Which Materials, Colors, and Silhouettes Are Gaining Ground?Fashion trends 2026 spotlight tactile fabrics, mineral colors, and controlled volume. Explore the materials, shades, and silhouettes shaping smarter, more wearable style.
 Smart Device Market Outlook: Key Growth Drivers, Segments, and Business OpportunitiesSmart device market trends are shifting toward system value, industrial demand, and resilient supply chains. Explore key growth drivers, high-potential segments, and business opportunities.
 How Global Trade Intelligence Services Help B2B Firms Evaluate Markets and SuppliersGlobal trade intelligence services help B2B firms compare suppliers, assess market potential, and uncover compliance, logistics, and pricing risks before costly decisions are made.
 Manufacturing Sector Updates for Investors: What Signals Matter Most in 2025?Manufacturing sector updates for investors in 2025: track orders, margins, supply chains, regulation, and exports to spot resilient manufacturers and smarter investment signals.
 How Energy Market Intelligence Helps Businesses Track Price Risks and Demand ShiftsEnergy market intelligence helps businesses spot price risks, demand shifts, and supply pressure early—improving procurement, resilience, and faster strategic decisions.
 Precision Hardware Tools Market: Key Demand Drivers, Segments, and Growth OutlookPrecision hardware tools market trends are reshaping sourcing, compliance, and automation. Explore key demand drivers, segment shifts, regional supply patterns, and growth opportunities.
 How to Use Customs Import Data to Find Buyers, Track Competitors, and Spot Demand?Customs import data helps you find real buyers, track competitors, and spot demand shifts early. Learn practical ways to turn trade records into smarter global business decisions.



















Global Trade Insights & Industry
Our mission is to empower global exporters and importers with data-driven insights that foster strategic growth.
Search News
Popular Tags
Industry Overview
The global commercial kitchen equipment market is projected to reach $112 billion by 2027. Driven by urbanization, the rise of e-commerce food delivery, and strict hygiene regulations.