

How Do You Calculate Solar ROI for a Commercial Building?
A commercial solar proposal can look convincing until the finance team asks a simple question: how much money will this system actually return? Panel prices are only part of the answer. Installation, roof condition, financing, electricity tariffs, maintenance, and available incentives all affect whether the investment makes sense.
Even temporary site access deserves attention. Comparing construction scaffolding rental vs purchase, when scaffolding is needed for roof access, can change the upfront budget. For building owners, procurement teams, and investors, a useful solar ROI calculation connects these practical costs with realistic energy savings—not just a supplier’s headline payback estimate.
What does solar ROI mean for a commercial building?
Solar return on investment measures the financial benefit of a photovoltaic system relative to the money invested. However, “ROI” is often used loosely in commercial proposals. One supplier may mean simple payback, while another means lifetime return or an annualized investment yield.
These measures answer different questions:
- Simple payback: How many years will estimated net savings take to recover the initial investment?
- Lifetime ROI: How much net financial benefit will the system generate over the chosen evaluation period, relative to its initial cost?
- Net present value, or NPV: What are future cash flows worth today after applying a discount rate?
- Internal rate of return, or IRR: What discount rate makes the project’s NPV equal to zero?
A project can have an attractive simple payback but a less attractive discounted return if major expenses occur later. For a capital approval decision, evaluate payback alongside NPV and IRR rather than treating one number as the verdict.
What information do you need before calculating returns?
Start with at least 12 months of electricity bills. Where available, obtain interval consumption data, such as 15-minute or hourly readings. Bills reveal spending; interval data reveals whether the building uses electricity when the solar system produces it.
A daytime manufacturing facility may consume most of its solar output directly. A warehouse with low daytime demand may export more electricity, potentially receiving a lower payment than the retail rate. Identical systems can therefore produce very different financial outcomes.
Your initial information pack should include:
- Electricity consumption, energy rates, time-of-use periods, and demand charges.
- A site-specific generation estimate accounting for shading, orientation, weather, and system losses.
- Roof condition, structural capacity, usable area, and expected remaining roof life.
- An itemized installation quote and interconnection requirements.
- Verified incentive eligibility, export arrangements, and applicable tax treatment.
- Operating costs, equipment replacement assumptions, and financing terms.
Also establish who owns the building and who pays the electricity bill. In leased premises, the party funding solar may not automatically receive the savings. Lease provisions and cost-recovery arrangements can be as important as panel efficiency.
How do you calculate the total investment?
Use the cost of delivering an operational system, not the price of panels alone. Include modules, inverters, mounting equipment, electrical work, engineering, permits, installation labor, monitoring, and grid connection.
Commercial sites may also require switchboard upgrades, structural reinforcement, lifting equipment, fall protection, or roof repairs. If a roof is approaching replacement, installing solar first may create a future removal-and-reinstallation expense.
A useful starting formula is:
Net initial investment = Total installed project cost − Eligible upfront grants, rebates, and immediately usable incentives
The timing matters. A tax credit received later is not the same as a rebate paid at installation. In a discounted cash-flow model, place each benefit in the year it is expected to become available. Confirm eligibility and tax treatment with qualified local advisers rather than assuming advertised incentives apply.
How does construction scaffolding rental vs purchase affect solar ROI?
Where the installation plan requires scaffolding, compare the full cost of access rather than the rental rate or purchase price in isolation. Rental costs can include delivery, erection, inspections, hire extensions, dismantling, and collection.
Purchasing adds storage, maintenance, inspections, transport, and the need for competent personnel. Residual resale value may offset some cost, but it should not be treated as guaranteed.
For a single rooftop project, rental may avoid tying up capital in equipment the owner rarely uses. For a contractor managing repeated installations, ownership may be worth evaluating across several projects. Allocate shared equipment costs consistently; do not charge the full purchase to one building while assuming later projects use it for free.
Whichever option is selected, safe access and regulatory compliance remain requirements. A cheaper access plan is not a financial improvement if it creates delays or unacceptable safety risks.
How do you estimate annual electricity savings?
The most important distinction is between solar electricity consumed on-site and electricity exported to the grid.
Annual energy value = (Self-consumed solar kWh × Avoided electricity rate) + (Exported solar kWh × Export compensation rate)
The avoided rate should represent charges that actually decline when grid purchases fall. Fixed connection charges generally remain. Under time-of-use tariffs, calculate savings using the rates applicable when solar generation offsets consumption—not a single blended bill rate unless it is a reasonable approximation.
Demand-charge savings require separate analysis. Solar may reduce peak demand, but an afternoon cloud or a peak occurring after sunset can limit that benefit. Model the building’s load and solar output against the utility’s billing rules before including demand savings.
Then subtract recurring expenses:
Annual net operating benefit = Energy savings + Export revenue + Verified recurring incentives − Operating costs
Operating costs may include maintenance, inspections, cleaning where necessary, monitoring subscriptions, insurance increases, and administrative charges. Keep these distinct from debt payments if you are evaluating the underlying project before financing.
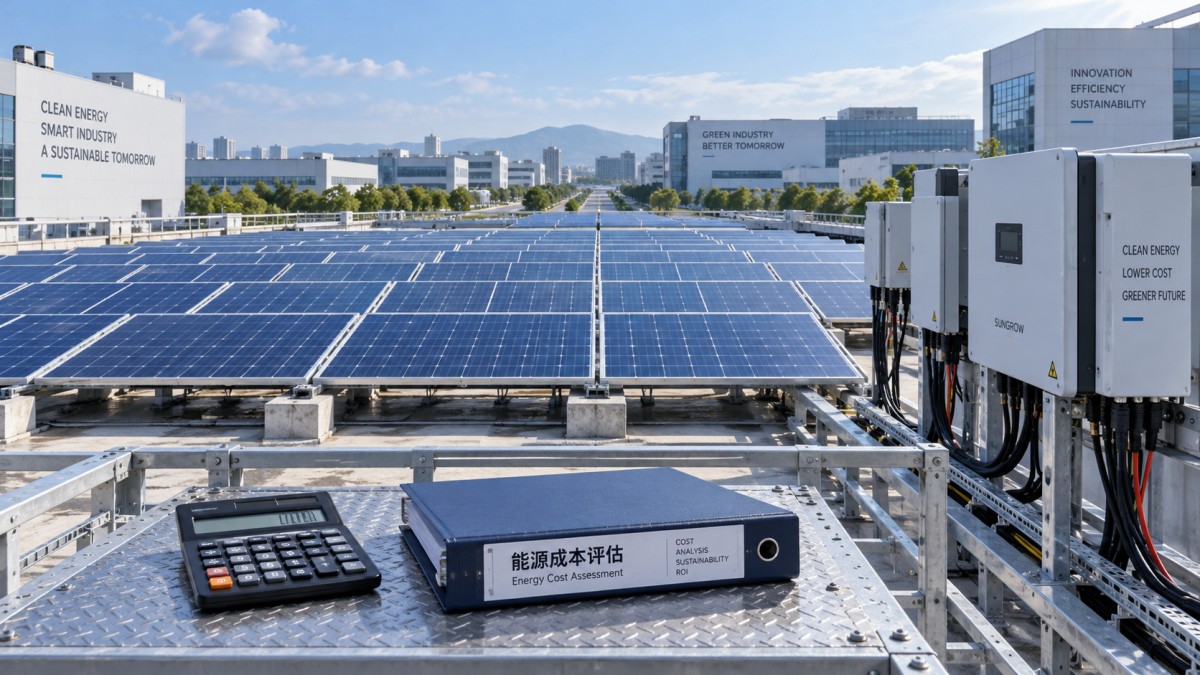
Can you show a simple commercial solar ROI calculation?
The following example uses illustrative assumptions, not market quotations or promised results. Figures are in dollars for convenience; the method applies in other currencies.
On-site consumption is 176,000 kWh, worth $28,160. The remaining 44,000 kWh is exported, earning $2,200. Total first-year energy value is therefore $30,360.
After subtracting operating costs, the first-year net operating benefit is $27,000.
Simple payback = $200,000 ÷ $27,000 = Approximately 7.4 years
The first-year net benefit divided by the investment is 13.5%, but this is neither lifetime ROI nor IRR. It also does not account for changing tariffs, degradation, financing, or later replacement costs. Treat it as an initial screening figure.
How do you calculate lifetime ROI and discounted returns?
Build a year-by-year model over a clearly stated evaluation period. Do not assume the panel warranty automatically defines the financial life of every component or the owner’s investment horizon.
For a simplified, unfinanced analysis:
Lifetime ROI (%) = [(Total operating benefits over the evaluation period − Later capital expenses − Net initial investment) ÷ Net initial investment] × 100
Here, operating benefits should already include recurring operating costs. Later capital expenses might include an inverter replacement or system removal for roofing work. Count each expense once.
For NPV, discount each future cash flow:
NPV = −Initial investment + Σ [Net cash flow in year t ÷ (1 + discount rate)t]
A positive NPV indicates that the modeled project exceeds the chosen required return. Select a discount rate consistent with the company’s capital policy, project risk, and treatment of inflation. Use nominal cash flows with a nominal discount rate, or real cash flows with a real rate.
IRR can be calculated using spreadsheet or financial software. Review it alongside NPV, especially when comparing projects of different sizes: a smaller project with a higher IRR may still create less total financial value.
Which assumptions can change the result most?
A credible forecast makes uncertainty visible. Several assumptions deserve particular scrutiny:
- Self-consumption: Occupancy changes, reduced production, or altered working hours can lower the value of solar generation.
- Electricity prices: Escalation increases projected savings, but aggressive assumptions can make a weak project appear attractive.
- Performance degradation: Apply an annual output decline supported by equipment documentation and modeling assumptions.
- Export rules: Export limits, compensation changes, or curtailment can reduce revenue.
- Maintenance and replacements: Model realistic service costs and potential major equipment expenses.
- Project timing: Permitting, equipment delivery, or interconnection delays can postpone savings and incentive receipts.
Run at least a base case and a downside case. The downside might combine lower output, reduced self-consumption, higher operating costs, and a delayed commissioning date. The purpose is not to predict every problem; it is to see whether the investment remains acceptable without optimistic assumptions.
How do financing, leases, and power purchase agreements change the calculation?
A cash purchase evaluates returns against the owner’s capital outlay. A loan introduces borrowing costs and repayment obligations. Distinguish project returns before financing from equity returns after financing.
For the equity model, include the owner’s initial contribution, loan proceeds where appropriate, debt service, fees, and relevant tax effects. Avoid subtracting the full system cost as owner equity and then counting loan principal repayments again without accounting for the financing inflow.
Under a solar lease or power purchase agreement, the building user may not own the system. The central calculation becomes avoided utility spending minus lease payments or solar electricity charges. Review escalation clauses, maintenance responsibilities, roof-access rights, buyout terms, and early termination provisions.
Low upfront cost can be appealing, but it does not automatically mean the highest lifetime benefit.
What should you ask before accepting a supplier’s ROI estimate?
Request the assumptions and cash-flow model, not just the summary chart. Ask whether the proposal includes roof work, scaffolding, electrical upgrades, grid fees, maintenance, replacement costs, and the actual export tariff.
When comparing suppliers across markets, procurement teams should also review equipment documentation, local compliance requirements, warranty enforceability, service availability, delivery terms, and currency exposure. These are trade and supply-chain questions with direct financial consequences.
For the business audience served by GTIIN, that connection matters: a competitive equipment quotation is only one part of a reliable investment decision. Delayed delivery or unclear after-sales responsibility can undermine otherwise attractive savings.
The strongest commercial solar ROI estimate is transparent enough to challenge. It shows where savings come from, when costs occur, and which assumptions could change the outcome. If the project still meets the building owner’s return requirements under reasonable downside conditions, the investment case becomes much easier to defend.
 Which macroeconomic indicators help forecast U.S. industrial demand?Explore industrial macro analysis USA decision-makers can use to forecast demand. Track new orders, inventories, and credit signals to sharpen procurement and capacity decisions.
 Can a food processing manufacturer meet your small-batch needs?Can a food processing manufacturer meet your small-batch needs? Discover how to assess minimum orders, costs, packaging, and safety to choose the right partner for your launch.
 How to verify sourcing intelligence data before selecting suppliersVerify sourcing intelligence data before choosing suppliers. Learn how to check company records, certifications, and capacity to reduce procurement risk and build a reliable shortlist.
 How to use supplier risk analysis to spot financial warning signsUse supplier risk analysis to spot cash flow pressure, debt risks, and delivery warning signs. Learn practical steps to reduce exposure and protect supply continuity.
 When dual sourcing makes sense in a sourcing strategy for manufacturersSourcing strategy for manufacturers: learn when dual sourcing strengthens supply continuity, reduces disruption risk, and protects production without adding unnecessary complexity.
 How bulk commodities pricing affects long-term supply contractsBulk commodities pricing shapes long-term supply contracts through index rules, freight, quality, volume, and currency risk. Explore strategies for resilient costs and supply security.
 Which global manufacturing trends by sector matter most for sourcing plans?Global manufacturing trends by sector: identify sourcing risks, supplier resilience, compliance demands, and cost drivers to build smarter, more reliable procurement plans.
 What industrial trade intelligence pricing should include before you subscribeIndustrial trade intelligence pricing explained: compare coverage, data quality, access rights, and workflow value before choosing a subscription that supports smarter trade decisions.
 How an industrial trade intelligence dashboard can identify new supplier marketsDiscover how an industrial trade intelligence dashboard helps identify new supplier markets by comparing capacity, landed cost, logistics resilience, and compliance risk.
 Which global market entry barriers should exporters assess first?Global market entry barriers exporters should assess first: tariffs, compliance, buyer qualification, logistics, and payment risk. Build a practical strategy for confident market entry.
 How trade data aggregation analytics can reveal emerging supplier marketsTrade data aggregation analytics reveals emerging supplier markets by connecting trade flows, capacity signals, logistics, and compliance insights for smarter sourcing decisions.
 When an export market analysis platform can validate demand in a new marketExport market analysis platform insights help validate new-market demand through buyer fit, regulations, logistics, competition, and profitable entry conditions.
 What is driving the beauty and personal care market in the USA?Beauty and personal care in USA is driven by targeted solutions, selective premiumization, digital discovery, clean-label trust, diverse needs, and compliance. Explore key growth opportunities.
 How trade flow monitoring reports reveal changing regional demandTrade flow monitoring reports reveal changing regional demand through import volumes, sourcing shifts, product mix, logistics signals, and regulatory trends. Explore actionable market insights.
 How international market intelligence for investors reduces market-entry riskInternational market intelligence for investors reduces market-entry risk by validating demand, regulations, logistics, and competition before capital is committed.
 How international sourcing intelligence helps identify supplier risk earlyInternational sourcing intelligence helps businesses spot supplier risks early, protect supply continuity, and make smarter global procurement decisions.
 How trade data aggregation analytics reveals emerging supplier marketsTrade data aggregation analytics reveals emerging supplier markets through export trends, input flows, logistics, and regulatory signals. Discover smarter sourcing insights.
 What industrial cluster monitoring in Vietnam reveals about site riskIndustrial cluster monitoring Vietnam reveals hidden site risks across labor, utilities, logistics, compliance, and supplier dependencies. Make smarter sourcing and expansion decisions.
 Food Technology Trends Reshaping Shelf Life, Safety, and Product InnovationFood technology is reshaping shelf life, safety, and innovation. Discover the trends helping food businesses cut risk, improve compliance, and unlock stronger global market growth.
 How electronics manufacturing services are changing with low-volume demandElectronics manufacturing services are evolving fast with low-volume demand. Learn how agile EMS partners improve flexibility, compliance, sourcing resilience, and speed to market.
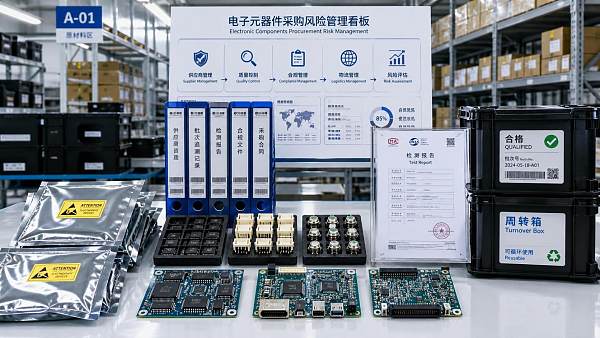
 How Can Buyers Reduce Procurement Risks for Electronic Components?How to reduce procurement risks for electronic components: learn how buyers assess traceability, lead times, compliance, and supplier types to avoid costly sourcing mistakes.

















Global Trade Insights & Industry
Our mission is to empower global exporters and importers with data-driven insights that foster strategic growth.
Search News
Popular Tags
Industry Overview
The global commercial kitchen equipment market is projected to reach $112 billion by 2027. Driven by urbanization, the rise of e-commerce food delivery, and strict hygiene regulations.