

Sustainable Power Options: Cost vs Stability in 2026
As 2026 approaches, finance decision-makers face a sharper trade-off between cost control and supply reliability in sustainable power planning. Volatile energy markets, policy shifts, and long-term capital pressures are forcing businesses to evaluate not only price, but also resilience and return. This article explores how sustainable power options compare in cost, stability, and strategic value, helping approval stakeholders make informed investment decisions with greater confidence.
For CFOs, procurement heads, and approval committees, the central question is no longer whether sustainable power matters. The real issue is which power mix can protect operating margins over 3–10 years while reducing exposure to supply disruption, tariff volatility, and compliance costs across global operations.
In cross-border trade, manufacturing, warehousing, and multi-site distribution, electricity is both a direct operating expense and a strategic risk variable. A sustainable power strategy that looks inexpensive in year 1 can become unstable by year 3 if grid congestion, curtailment, balancing costs, or weak contract design are ignored.
Why Cost vs Stability Is the Core Sustainable Power Decision in 2026
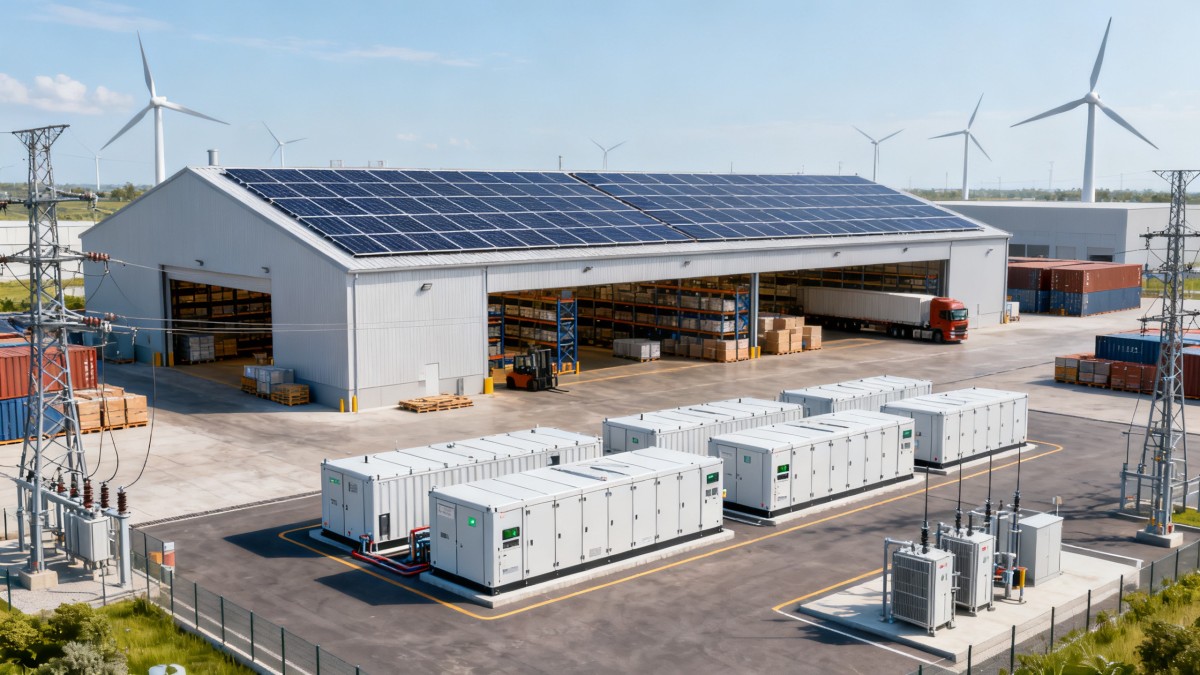
The sustainable power market is maturing, but not evenly. Solar, wind, storage, renewable certificates, and hybrid sourcing models each offer different cost profiles, contract terms, and reliability characteristics. For financial approvers, the best option is rarely the lowest nominal price; it is the option with the strongest risk-adjusted value.
Three forces are shaping 2026 planning. First, capital remains selective, with many firms using approval thresholds tied to payback periods of 3–7 years. Second, energy price swings still affect budgeting accuracy, especially for importers and exporters exposed to multiple grids. Third, compliance expectations are becoming stricter in procurement, reporting, and supplier qualification.
What finance teams are really measuring
Most finance teams now review sustainable power through at least four lenses: delivered cost per kWh, price predictability over contract duration, operational uptime impact, and capital intensity. A project that lowers energy spend by 8% but increases interruption risk may fail approval when downtime costs exceed the savings.
- Short-term operating expense impact: monthly and quarterly budget pressure
- Mid-term cash flow visibility: 12–36 month cost forecast accuracy
- Business continuity value: outage tolerance, backup capability, and site resilience
- Strategic compliance value: alignment with customer audits and supply chain requirements
Why low-cost power can still become expensive
A low headline rate may hide balancing charges, transmission fees, renewable intermittency, curtailment exposure, or contract floors. In practice, the gap between contracted price and delivered energy cost can widen by 10%–25% if risk allocation is poorly defined. This is especially relevant for facilities operating 16–24 hours per day.
The table below compares common sustainable power sourcing routes from a financial approval perspective, focusing on cost control, reliability, and implementation complexity rather than marketing claims.
The comparison shows a consistent pattern: lower upfront commitment usually means easier rollout but weaker long-term protection against price shocks. Higher stability often comes from either capital investment, longer contracts, or a hybrid structure that spreads risk across 2–3 sourcing methods.
Comparing Sustainable Power Options by Financial Logic
Approval stakeholders often need a practical framework that translates technical energy choices into finance language. In 2026, that means linking each sustainable power option to cash flow timing, contract risk, and operational dependence. The sections below break down the most common routes used across industrial and trade-related businesses.
On-site solar: strongest for long-hold assets
On-site solar usually works best where facilities are owned or held under long leases of 10 years or more. The financial case improves when daytime consumption is high, local power prices are elevated, and roof loading or land access is not a constraint. Typical evaluation windows range from 48 to 96 months.
Where it fits
- Warehouses with predictable daytime loads
- Export processing sites with stable annual utilization above 70%
- Industrial campuses seeking partial self-generation and emissions reduction
What finance teams should test
- Annual degradation assumptions over 15–20 years
- Maintenance reserves and inverter replacement timing in years 8–12
- Residual asset value under relocation or site disposal scenarios
PPAs: strong hedge value, but structure matters
Power purchase agreements can deliver better budget certainty than exposed spot procurement. However, there is a major difference between physical and virtual structures. A 7-year contract that locks an attractive strike price may still produce accounting and settlement complexity if the consumption profile does not align with generation shape.
For finance approvers, the core question is not just tariff competitiveness. It is whether the agreement reduces total power spend volatility after imbalance, shaping, and basis risks are considered. This is especially important for enterprises with plants in 2 or more jurisdictions.
Battery-backed systems: stability premium with measurable use cases
Battery storage should not be treated as a universal add-on. It makes the most sense in locations with demand charges, fragile grids, or revenue loss from even short outages. A system sized for 1–2 critical hours can often protect higher-value operations more efficiently than a system designed for full-day autonomy.
In sectors tied to logistics, cold storage, electronics, or process continuity, a 15-minute interruption may cost more than several months of battery financing. That is why stability should be priced not only through energy rates, but through avoided downtime, product spoilage, and restart losses.
A Practical Approval Framework for CFOs and Procurement Leaders
A useful sustainable power decision process is built around thresholds rather than slogans. Finance teams need a repeatable model that compares options using the same assumptions on cost, risk, and resilience. In most B2B settings, five checkpoints are enough to screen serious proposals and reject weak ones early.
Five-step evaluation process
- Map load profile by hour, season, and critical process for at least 12 months.
- Separate essential load from flexible load and quantify outage cost per hour.
- Compare CAPEX, OPEX, and contract obligations across 3 scenarios.
- Stress-test price assumptions using low, base, and high market cases.
- Review legal, site, and supplier execution risks before final approval.
The next table summarizes the decision criteria that finance stakeholders typically use when comparing sustainable power investments across multiple sites or operating units.
This framework helps prevent a common error: approving sustainable power based only on expected unit cost savings. A better approach is to score each option against cost, stability, contract complexity, and implementation speed. In many cases, the winning choice is a blended model rather than a single-source solution.
Common approval mistakes to avoid
- Using annual average load instead of hourly or shift-based demand patterns
- Ignoring grid fees, balancing charges, or curtailment clauses in “low-cost” contracts
- Over-sizing backup systems for all loads instead of protecting critical loads first
- Assuming sustainability benefits automatically justify weak financial returns
- Comparing 2-year budget impact against 15-year asset life without scenario adjustment
How to Build a Balanced Sustainable Power Portfolio
For many global businesses, the most resilient answer in 2026 is not a binary choice between cheap energy and stable energy. It is a portfolio strategy. This can combine 20%–40% on-site generation, a medium-term PPA or green supply contract, and targeted storage or backup support for high-value operations.
That mix allows finance teams to separate strategic load from transactional load. Stable base demand can be covered through long-duration arrangements, while variable demand stays partially exposed to market opportunities. The result is better flexibility without full price exposure.
Recommended portfolio logic by business profile
Single-site owner-operators
These businesses often benefit from on-site solar plus selective battery support, especially when the facility is core to operations and held long term. If peak demand penalties are high, even a modest battery duration can improve project economics.
Multi-site trading and distribution groups
A retail green supply structure or portfolio PPA may be easier to implement across 5, 20, or 50 sites. Standardized contracting reduces administrative overhead, while site-by-site upgrades can be phased where the return is strongest.
Energy-intensive manufacturers
These firms usually need a layered strategy: contract hedging for bulk power, site-level efficiency measures, and resilience planning for critical production lines. Sustainable power decisions should be integrated with maintenance schedules, line uptime targets, and export order commitments.
What implementation discipline looks like
Strong execution depends on data quality and governance. At minimum, approval teams should request 12 months of interval consumption data, a site constraint review, a supplier risk check, and a contract summary that clearly identifies who bears volume, market, and performance risk.
A disciplined rollout typically happens in 3 phases: diagnostic review, commercial comparison, and controlled deployment. This allows businesses to test one facility or one region first, then scale based on measured savings, operational stability, and supplier responsiveness over the next 6–12 months.
Questions Financial Approvers Should Ask Before Signing
Is the savings case volume-sensitive?
If projected returns depend on consumption staying within a narrow band, the contract may underperform when production shifts. Ask how savings change if demand falls by 15% or rises by 20%.
What happens during low generation or grid stress?
Sustainable power should be evaluated under adverse conditions, not just ideal ones. Request a clear explanation of fallback supply, backup duration, and any cost exposure during peak grid events.
How portable is the solution?
This matters for leased facilities, acquisitions, or footprint changes. A solution with a 7-year economic logic may become less attractive if the site strategy can change within 24–36 months.
In 2026, sustainable power decisions will increasingly be judged by their ability to protect margin, support continuity, and strengthen supply chain credibility at the same time. Cost remains essential, but stability is now a finance issue, not only an engineering one.
For approval stakeholders across global trade and industry, the strongest path is usually a measured, data-based combination of price hedging, selective self-generation, and resilience planning. That approach reduces uncertainty without forcing capital into poorly matched assets or overly rigid contracts.
GTIIN and TradeVantage help businesses evaluate market shifts, supplier signals, and strategic sourcing trends with the clarity needed for better decisions. If you are assessing sustainable power options for 2026, contact us to get a tailored intelligence view, compare solution pathways, and explore a more confident approval strategy.
 Which global manufacturing trends by sector matter most for sourcing plans?Global manufacturing trends by sector: identify sourcing risks, supplier resilience, compliance demands, and cost drivers to build smarter, more reliable procurement plans.
 What industrial trade intelligence pricing should include before you subscribeIndustrial trade intelligence pricing explained: compare coverage, data quality, access rights, and workflow value before choosing a subscription that supports smarter trade decisions.
 How an industrial trade intelligence dashboard can identify new supplier marketsDiscover how an industrial trade intelligence dashboard helps identify new supplier markets by comparing capacity, landed cost, logistics resilience, and compliance risk.
 Which global market entry barriers should exporters assess first?Global market entry barriers exporters should assess first: tariffs, compliance, buyer qualification, logistics, and payment risk. Build a practical strategy for confident market entry.
 How trade data aggregation analytics can reveal emerging supplier marketsTrade data aggregation analytics reveals emerging supplier markets by connecting trade flows, capacity signals, logistics, and compliance insights for smarter sourcing decisions.
 When an export market analysis platform can validate demand in a new marketExport market analysis platform insights help validate new-market demand through buyer fit, regulations, logistics, competition, and profitable entry conditions.
 What is driving the beauty and personal care market in the USA?Beauty and personal care in USA is driven by targeted solutions, selective premiumization, digital discovery, clean-label trust, diverse needs, and compliance. Explore key growth opportunities.
 How trade flow monitoring reports reveal changing regional demandTrade flow monitoring reports reveal changing regional demand through import volumes, sourcing shifts, product mix, logistics signals, and regulatory trends. Explore actionable market insights.
 How international market intelligence for investors reduces market-entry riskInternational market intelligence for investors reduces market-entry risk by validating demand, regulations, logistics, and competition before capital is committed.
 How international sourcing intelligence helps identify supplier risk earlyInternational sourcing intelligence helps businesses spot supplier risks early, protect supply continuity, and make smarter global procurement decisions.
 How trade data aggregation analytics reveals emerging supplier marketsTrade data aggregation analytics reveals emerging supplier markets through export trends, input flows, logistics, and regulatory signals. Discover smarter sourcing insights.
 What industrial cluster monitoring in Vietnam reveals about site riskIndustrial cluster monitoring Vietnam reveals hidden site risks across labor, utilities, logistics, compliance, and supplier dependencies. Make smarter sourcing and expansion decisions.
 Food Technology Trends Reshaping Shelf Life, Safety, and Product InnovationFood technology is reshaping shelf life, safety, and innovation. Discover the trends helping food businesses cut risk, improve compliance, and unlock stronger global market growth.
 How electronics manufacturing services are changing with low-volume demandElectronics manufacturing services are evolving fast with low-volume demand. Learn how agile EMS partners improve flexibility, compliance, sourcing resilience, and speed to market.
 How Can Buyers Reduce Procurement Risks for Electronic Components?How to reduce procurement risks for electronic components: learn how buyers assess traceability, lead times, compliance, and supplier types to avoid costly sourcing mistakes.
 What Sourcing Intelligence India Reveals About Supplier Risk and Cost ShiftsSourcing intelligence India reveals hidden supplier risk, compliance gaps, logistics pressure, and real cost shifts—helping buyers compare vendors smarter and source with more confidence.
 Fashion Trends 2026: Which Materials, Colors, and Silhouettes Are Gaining Ground?Fashion trends 2026 spotlight tactile fabrics, mineral colors, and controlled volume. Explore the materials, shades, and silhouettes shaping smarter, more wearable style.
 Smart Device Market Outlook: Key Growth Drivers, Segments, and Business OpportunitiesSmart device market trends are shifting toward system value, industrial demand, and resilient supply chains. Explore key growth drivers, high-potential segments, and business opportunities.
 How Global Trade Intelligence Services Help B2B Firms Evaluate Markets and SuppliersGlobal trade intelligence services help B2B firms compare suppliers, assess market potential, and uncover compliance, logistics, and pricing risks before costly decisions are made.
 Manufacturing Sector Updates for Investors: What Signals Matter Most in 2025?Manufacturing sector updates for investors in 2025: track orders, margins, supply chains, regulation, and exports to spot resilient manufacturers and smarter investment signals.
 How Energy Market Intelligence Helps Businesses Track Price Risks and Demand ShiftsEnergy market intelligence helps businesses spot price risks, demand shifts, and supply pressure early—improving procurement, resilience, and faster strategic decisions.




















Global Trade Insights & Industry
Our mission is to empower global exporters and importers with data-driven insights that foster strategic growth.
Search News
Popular Tags
Industry Overview
The global commercial kitchen equipment market is projected to reach $112 billion by 2027. Driven by urbanization, the rise of e-commerce food delivery, and strict hygiene regulations.